
#Introduction
Investors often look at the Indian stock market and see a paradox: valuations that seem perpetually expensive and price swings that feel disproportionately violent. While global commentators often attribute this to India's "growth story" or the unpredictable nature of Foreign Institutional Investor (FII) flows, the real answer isn't found in buyer sentiment. It is found in the physical architecture of the exchange — a phenomenon I call the "Vertical Wall."
To understand Indian price discovery, one must look past the ticker tape and toward the market's underlying plumbing. In most developed markets, the rules of supply and demand operate within a wide, fluid channel. In India, those same rules are forced through a narrow bottleneck, creating a structural constraint that governs everything from IPO pricing to sudden market crashes.
This isn't a failure of the market mechanism itself; rather, it is a feature of a specific, defensive design. By tracing the history of corporate India back to a single pivotal moment in the 1980s, we can see how fear — rather than economic efficiency — constructed the vertical supply curve that defines Dalal Street today.
#The 1983 Ghost That Still Haunts Dalal Street
The current structure of the Indian market was born out of a panic that occurred forty years ago. In 1983, Swraj Paul, a London-based NRI, launched hostile takeover attempts against two industrial titans: Escorts and DCM. At the time, the controlling families held dangerously low stakes; HP Nanda ran Escorts with less than 5%, while the Shriram family controlled DCM with about 10%.
Using shell companies, Paul accumulated more shares than the promoters themselves held. The raids only failed because the Life Insurance Corporation (LIC) and other institutions opposed the transfers, effectively freezing Paul out. This intervention saved the promoters, but it shattered the confidence of every industrialist in India.
The reaction was a massive, 180-degree reversal of market philosophy. Before 1983, companies seeking to list were required to offer 60% of their shares to the public. After the Paul raids, promoters began "defensive hoarding," consolidating holdings until 70–80% of companies were locked away from the public.
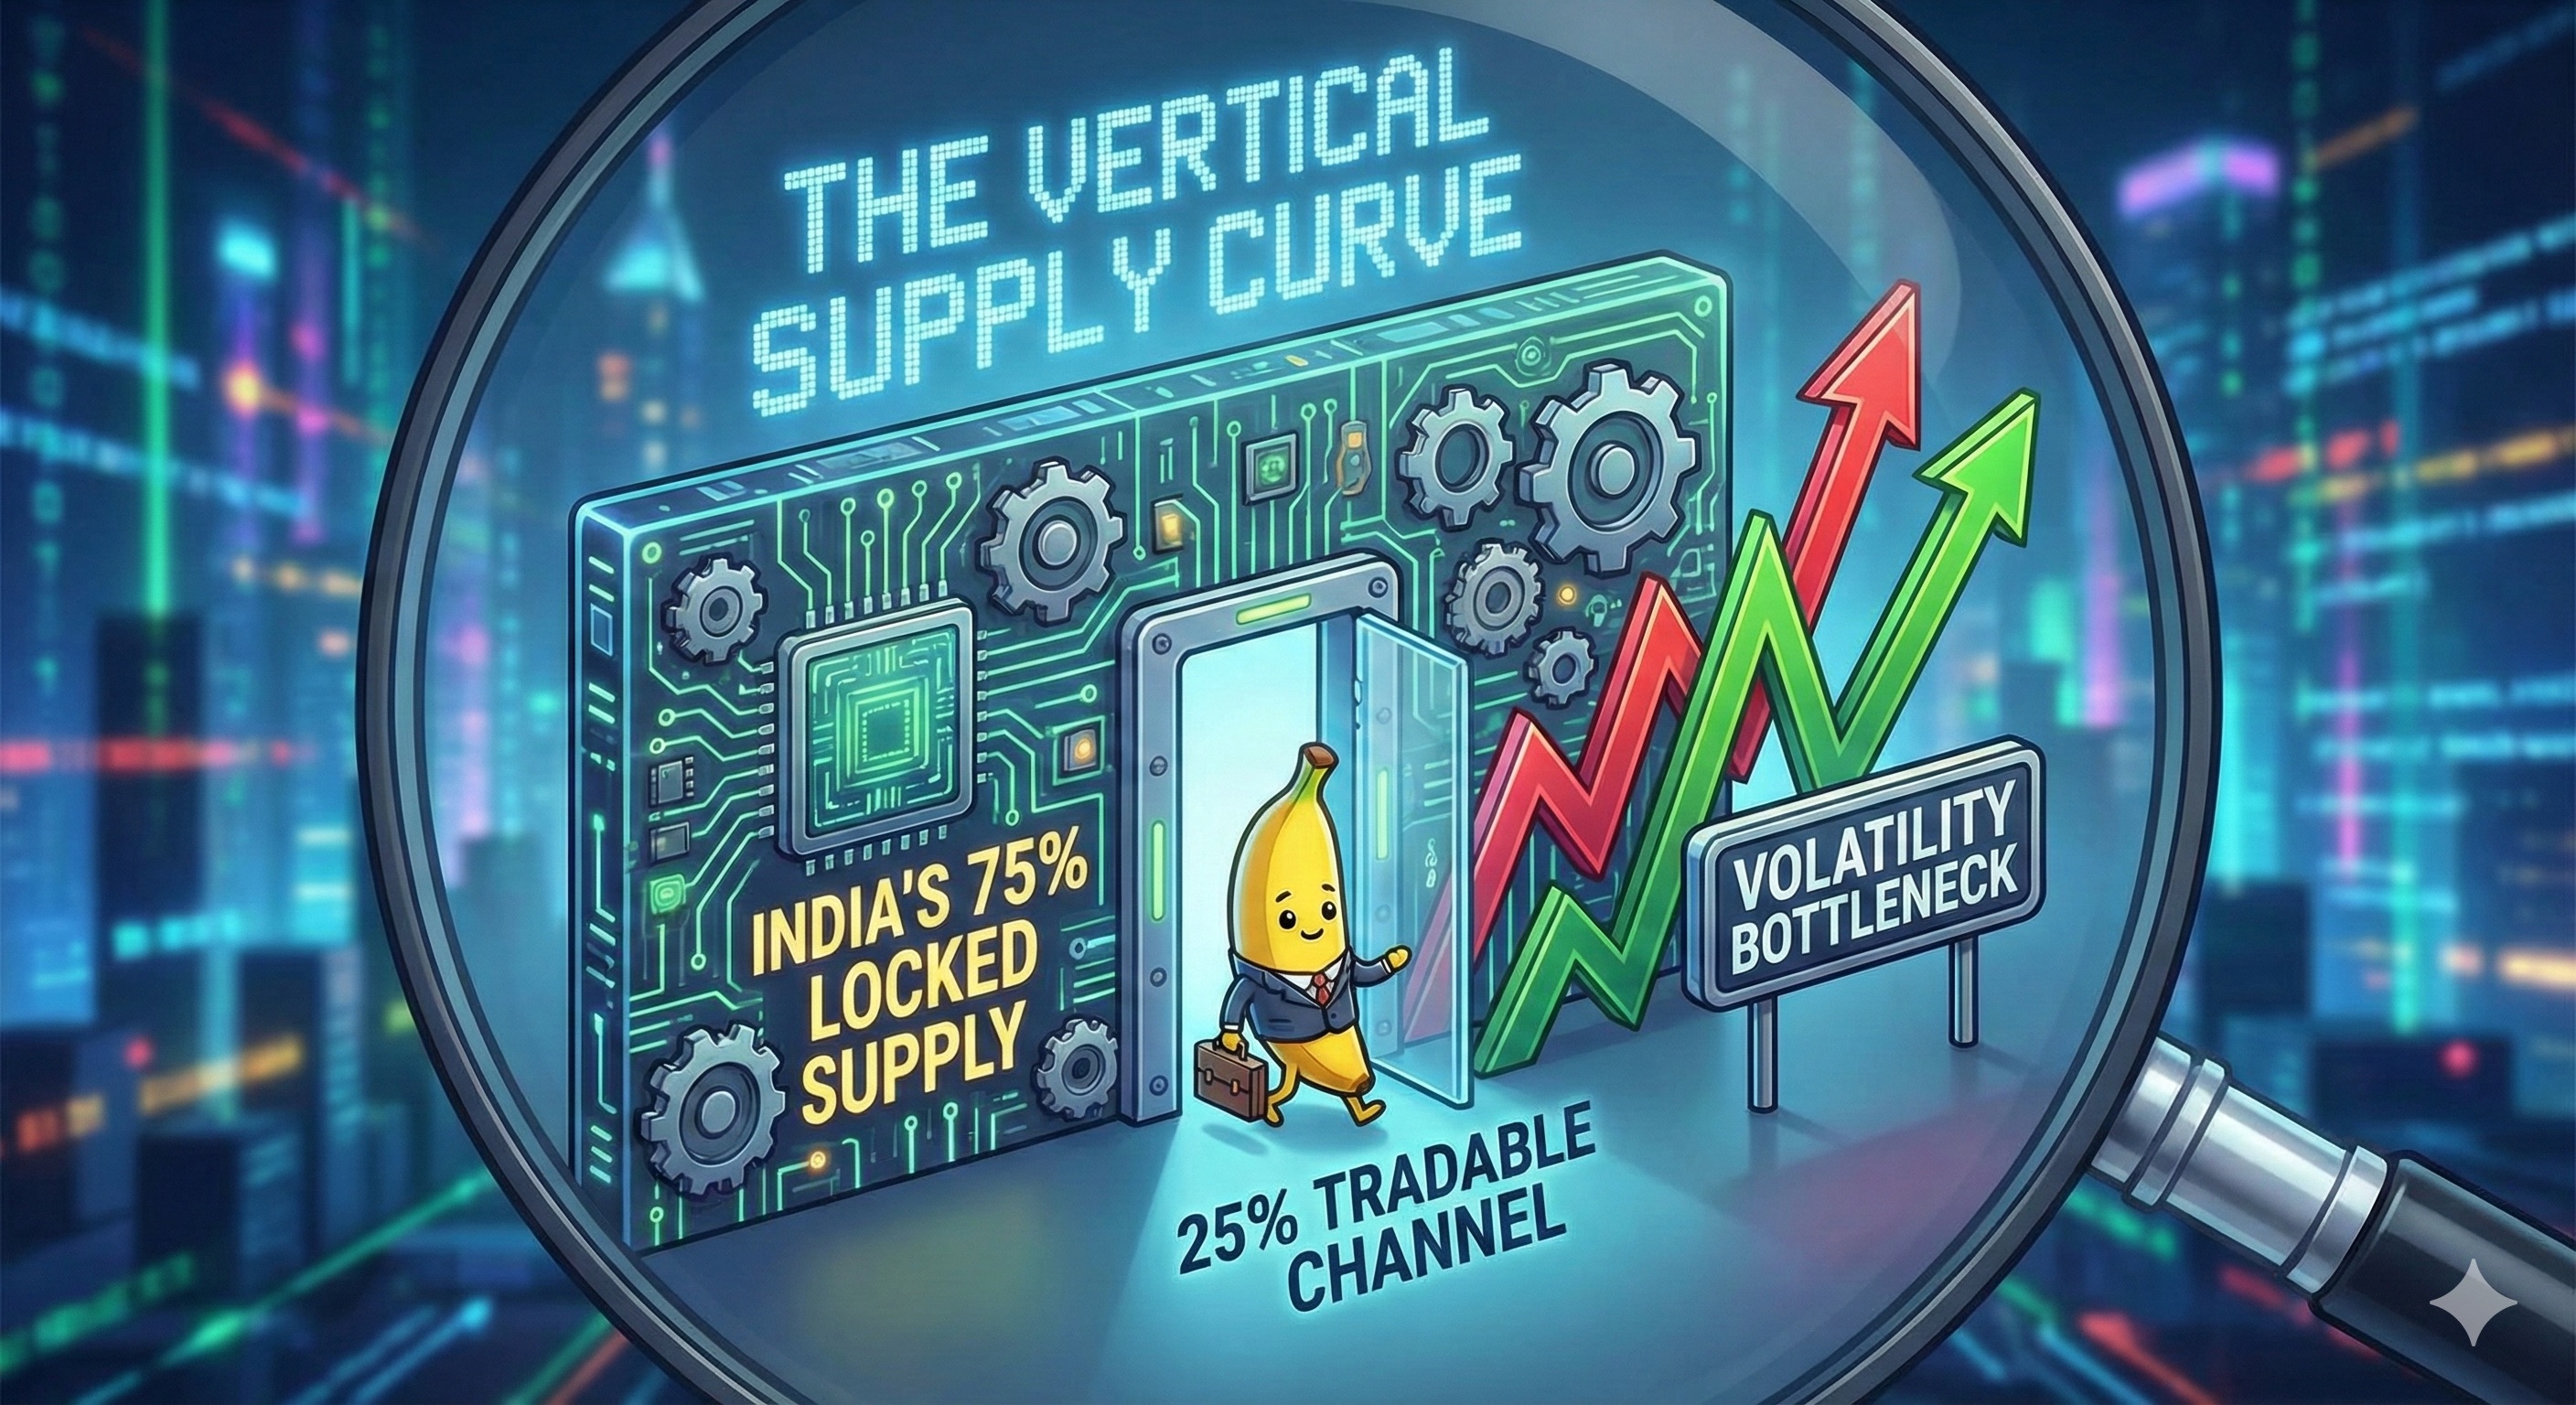
Today, SEBI mandates a minimum 25% public float, effectively normalizing a structure where 75% of a company remains "dead supply." What was once a market characterized by public participation became one dominated by insider ownership. Fear, not optimal design, shaped the current market.
#The "Vertical Supply Curve" and the Commodity Trap
To understand why this hoarding matters, we must distinguish between different types of supply. Jeff Currie, a legendary voice in global markets, highlights a fundamental distinction between how prices are formed in commodities versus equities:
"In commodities and in FX rates... for every long, there's a short. So if I'm buying, somebody had to introduce that short on the other side. There is no constraint... An equity is long only. The SEC controls the amount of supply of an equity. So when an investor buys an equity, he's buying against a vertical supply curve. So as he buys it, he can push it up."
In a commodity market, supply is elastic; if demand for wheat rises, shorts can be created to balance the trade. In equities, however, the supply is fixed by the regulator. Because supply cannot expand to meet a surge in demand, the only way for the market to reach equilibrium is for the price to rise sharply.
This leads to a critical "aha!" moment: "hot money" cannot drive price discovery in commodities because fundamentals eventually provide supply. In equities, however, hot money is the price driver because the vertical supply curve offers no escape valve. In India, this supply curve isn't just vertical; it's reinforced steel.
#India's Extreme Math (75% vs. 1%)
The vertical supply curve exists globally, but India represents the most extreme version of this mathematics. In the United States, major companies are professionally managed with highly dispersed ownership. For example, Bill Gates is the face of Microsoft, yet he holds less than 1% of the free float.
In India, the norm is a 75% promoter holding, creating a regulatory bottleneck. This structure is perfectly mirrored by the oil hub of Cushing, Oklahoma. In 2020, limited physical storage in Cushing meant that even modest selling pressure forced the clearing price to an absurd -$40 (negative) per barrel.
Key Structural Elements:
- Locked Supply: 75% of shares are with promoters who rarely, if ever, sell during normal market cycles.
- The Narrow Channel: Price discovery for the entire company is forced through a tiny 25% channel of tradable shares.
- Amplified Magnitude: Because three-quarters of the supply cannot respond to price changes, any marginal inflow or outflow causes a disproportionate price move.
#FIIs Are the Symptom, the Structure Is the Cause
When the market drops, the financial media is quick to blame FII selling. However, this narrative confuses the trigger with the structural cause. The volatility we attribute to foreign investors is actually a function of the supply constraint.
Consider a counterfactual: Imagine an FII outflow of ₹50,000 crore. In a theoretical market with a 50% free float, that selling pressure is distributed across a large pool of shares. In India's actual 25% float market, that same pressure hits a wall because 75% of the supply is locked and cannot respond.
To find enough buyers among the tiny 25% pool, the clearing price must "overshoot" on the downside. We saw this extreme logic at play in Cushing's -$40 oil; the mechanism still worked, but the structure dictated how violent the price move had to be.
Key Realization: The clearing price mechanism still works, but India's constrained supply structure ensures that prices must move with significantly more magnitude to find equilibrium among the tradable 25%.
#The Institutionalization of a Bottleneck
If a 25% free float causes such extreme volatility, why haven't regulators increased the requirement to 50%? The answer is "regulatory capture." The current system provides significant benefits to a powerful group of stakeholders who prefer the status quo:
- Promoters: They maintain absolute control without the threat of another Swraj Paul-style raid.
- Investment Bankers: Scarcity helps support high IPO pricing and successful share sales.
- Media: FII flows provide a simple, recurring narrative for daily market movements.
- Regulators: Avoiding the political controversy of forcing promoters to dilute their stakes.
Expanding the float to 50% is economically sensible for market health and efficiency. However, it remains politically difficult because it would dismantle the defensive walls built after the 1983 scare.
#Conclusion: Beyond the Vertical Wall
India's stock market volatility isn't a mystery; it is the logical outcome of its architecture. The "Vertical Wall" ensures that every marginal rupee of inflow or outflow has an amplified impact on price. This structure is a relic of a 40-year-old takeover scare that has been institutionalized into the very fabric of the exchange.
While the clearing price mechanism still functions, it does so through a narrow, constrained channel that produces more extreme outcomes than fundamentals justify. We must ask: can the Indian market truly be considered "developed" if its core mechanism is still a defensive crouch from the Cold War era?
The volatility we blame on external flows is actually the price we pay for a market structure built on the fear of 1983.
Sources & Research Notes:
- FII Flows and Indian Stock Market Movements Are Not the Same 'Ting'
- Swraj Paul was an important and influential figure of 20th Century India — Vir Sanghvi
- Hostile Takeovers In India — Mondaq
- Requirement of Public Holding for Listing
- Minimum Public Shareholding in India: Rules, Guidelines and Implications — 5paisa
